每人linux系统管理员必须知道的20条监控工具
日期:2014-05-16 浏览次数:21328 次
- Finding out bottlenecks.
- Disk (storage)??bottlenecks.
- CPU and memory bottlenecks.
- Network bottlenecks.
#1: top - Process Activity CommandThe top program provides a dynamic
real-time view of a runningsystem i.e. actual process activity. By
default, it displays the mostCPU-intensive tasks running on the server
and updates the list everyfive seconds.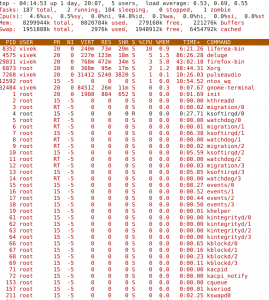 Fig.01: Linux top command
Commonly Used Hot KeysThe top command provides several useful hot keys:
| Hot Key | Usage |
| t | Displays summary information off and on. |
| m | Displays memory information off and on. |
| A | Sorts the display by top consumers of various system resources.Useful for quick identification of performance-hungry tasks on a system. |
| f | Enters an interactive configuration screen for top. Helpful for setting up top for a specific task. |
| o | Enables you to interactively select the ordering within top. |
| r | Issues renice command. |
| k | Issues kill command. |
| z | Turn on or off color/mono |
=> Related:
How do I Find Out Linux CPU Utilization?
#2: vmstat - System Activity, Hardware and System InformationThe
command vmstat reports information about processes, memory, paging,
block IO, traps, and cpu activity.
# vmstat 3
Sample Outputs:
procs -----------memory---------- ---swap-- -----io---- --system-- -----cpu------
r??b? ?swpd? ?free? ?buff??cache? ?si? ?so? ? bi? ? bo? ?in? ?cs us sy id wa st
0??0? ?? ?0 2540988 522188 5130400? ? 0? ? 0? ???2? ? 32? ? 4? ? 2??4??1 96??0??0
1??0? ?? ?0 2540988 522188 5130400? ? 0? ? 0? ???0? ?720 1199??665??1??0 99??0??0
0??0? ?? ?0 2540956 522188 5130400? ? 0? ? 0? ???0? ???0 1151 1569??4??1 95??0??0
0??0? ?? ?0 2540956 522188 5130500? ? 0? ? 0? ???0? ???6 1117??439??1??0 99??0??0
0??0? ?? ?0 2540940 522188 5130512? ? 0? ? 0? ???0? ?536 1189??932??1??0 98??0??0
0??0? ?? ?0 2538444 522188 5130588? ? 0? ? 0? ???0? ???0 1187 1417??4??1 96??0??0
0??0? ?? ?0 2490060 522188 5130640? ? 0? ? 0? ???0? ? 18 1253 1123??5??1 94??0??0Display Memory Utilization Slabinfo# vmstat -m
Get Information About Active / Inactive Memory Pages# vmstat -a
=> Related:
How do I find out Linux Resource utilization to detect system bottlenecks?
#3: w - Find Out Who Is Logged on And What They Are Doingw command
displays information about the users currently on the machine, and
their processes.
# w username
# w vivek
Sample Outputs:
17:58:47 up 5 days, 20:28,??2 users,??load average: 0.36, 0.26, 0.24
USER? ???TTY? ?? ?FROM? ?? ?? ?? ???LOGIN@? ?IDLE? ?JCPU? ?PCPU WHAT
root? ???pts/0? ? 10.1.3.145? ?? ? 14:55? ? 5.00s??0.04s??0.02s vim /etc/resolv.conf
root? ???pts/1? ? 10.1.3.145? ?? ? 17:43? ? 0.00s??0.03s??0.00s w
#4: uptime - Tell How Long The System Has Been RunningThe uptime
command can be used to see how long the server has beenrunning. The
current time, how long the system has been running, howmany users are
currently logged on, and the system load averages forthe past 1, 5, and
15 minutes.
# uptime
Output:
18:02:41 up 41 days, 23:42,??1 user,??load average: 0.00, 0.00, 0.001
can be considered as optimal load value. The load can change fromsystem
to system. For a single CPU system 1 - 3 and SMP systems 6-10load value
might be acceptable.
#5: ps - Displays The Processesps command will report a snapshot of the
current processes. To select all p