20个Linux 系统监控下令
日期:2014-05-16 浏览次数:21344 次
20个Linux 系统监控命令
本文只是摘录,更详细的请参阅全文:
http://www.cyberciti.biz/tips/top-linux-monitoring-tools.html
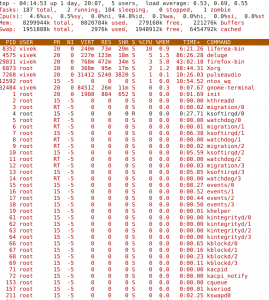
#1: top - Process Activity Command
top/topas(系统版本为5或者高于5的aix的top替代品)
Commonly Used Hot Keys
The top command provides several useful hot keys:
Hot Key Usage
t Displays summary information off and on.
m Displays memory information off and on.
A Sorts the display by top consumers of various system resources. Useful for quick identification of performance-hungry tasks on a system.
f Enters an interactive configuration screen for top. Helpful for setting up top for a specific task.
o Enables you to interactively select the ordering within top.
r Issues renice command.
k Issues kill command.
z Turn on or off color/mono
#2: vmstat - System Activity, Hardware and System Information
The command vmstat reports information about processes, memory, paging, block IO, traps, and cpu activity.
#3: w - Find Out Who Is Logged on And What They Are Doing
#4: uptime - Tell How Long The System Has Been Running
#5: ps - Displays The Processes
#6: free - Memory Usage
The command free displays the total amount of free and used physical and swap memory in the system, as well as the buffers used by the kernel.
#7: iostat - Average CPU Load, Disk Activity
#8: sar - Collect and Report System Activity
#9: mpstat - Multiprocessor Usage
The mpstat command displays activities for each available processor, processor 0 being the first one. mpstat -P ALL to display average CPU utilization per processor:
#10: pmap - Process Memory Usage
The command pmap report memory map of a process. Use this command to find out causes of memory bottlenecks.
#11 and #12: netstat and ss - Network Statistics
#13: iptraf - Real-time Network Statistics
#14: tcpdump - Detailed Network Traffic Analysis
#15: strace - System Calls
#16: /Proc file system - Various Kernel Statistics
17#: Nagios - Server And Network Monitoring
18#: Cacti - Web-based Monitoring Tool
#19: KDE System Guard - Real-time Systems Reporting and Graphing
#20: Gnome System Monitor - Real-time Systems Reporting and Graphing
本文转载自:http://www.cyberciti.biz/tips/top-linux-monitoring-tools.html
本文只是摘录,更详细的请参阅全文:
http://www.cyberciti.biz/tips/top-linux-monitoring-tools.html
#1: top - Process Activity Command
top/topas(系统版本为5或者高于5的aix的top替代品)
Commonly Used Hot Keys
The top command provides several useful hot keys:
Hot Key Usage
t Displays summary information off and on.
m Displays memory information off and on.
A Sorts the display by top consumers of various system resources. Useful for quick identification of performance-hungry tasks on a system.
f Enters an interactive configuration screen for top. Helpful for setting up top for a specific task.
o Enables you to interactively select the ordering within top.
r Issues renice command.
k Issues kill command.
z Turn on or off color/mono
#2: vmstat - System Activity, Hardware and System Information
The command vmstat reports information about processes, memory, paging, block IO, traps, and cpu activity.
# vmstat 3
procs -----------memory---------- ---swap-- -----io---- --system-- -----cpu------
 r  b   swpd   free   buff  cache   si   so    bi    bo   in   cs us sy id wa st
 0  0      0 2540988 522188 5130400    0    0     2    32    4    2  4  1 96  0  0
 1  0      0 2540988 522188 5130400    0    0     0   720 1199  665  1  0 99  0  0
 0  0      0 2540956 522188 5130400    0    0     0     0 1151 1569  4  1 95  0  0
 0  0      0 2540956 522188 5130500    0    0     0     6 1117  439  1  0 99  0  0
 0  0      0 2540940 522188 5130512    0    0     0   536 1189  932  1  0 98  0  0
 0  0      0 2538444 522188 5130588    0    0     0     0 1187 1417  4  1 96  0  0
 0  0      0 2490060 522188 5130640    0    0     0    18 1253 1123  5  1 94  0  0
#3: w - Find Out Who Is Logged on And What They Are Doing
#4: uptime - Tell How Long The System Has Been Running
#5: ps - Displays The Processes
#6: free - Memory Usage
The command free displays the total amount of free and used physical and swap memory in the system, as well as the buffers used by the kernel.
#7: iostat - Average CPU Load, Disk Activity
#8: sar - Collect and Report System Activity
#9: mpstat - Multiprocessor Usage
The mpstat command displays activities for each available processor, processor 0 being the first one. mpstat -P ALL to display average CPU utilization per processor:
#10: pmap - Process Memory Usage
The command pmap report memory map of a process. Use this command to find out causes of memory bottlenecks.
#11 and #12: netstat and ss - Network Statistics
#13: iptraf - Real-time Network Statistics
#14: tcpdump - Detailed Network Traffic Analysis
#15: strace - System Calls
#16: /Proc file system - Various Kernel Statistics
17#: Nagios - Server And Network Monitoring
18#: Cacti - Web-based Monitoring Tool
#19: KDE System Guard - Real-time Systems Reporting and Graphing
#20: Gnome System Monitor - Real-time Systems Reporting and Graphing
本文转载自:http://www.cyberciti.biz/tips/top-linux-monitoring-tools.html
免责声明: 本文仅代表作者个人观点,与爱易网无关。其原创性以及文中陈述文字和内容未经本站证实,对本文以及其中全部或者部分内容、文字的真实性、完整性、及时性本站不作任何保证或承诺,请读者仅作参考,并请自行核实相关内容。